Are you a phone addict?
- How much time you used one app?
- How many times you unlocked your phone?
- Which app send you the most notifications?


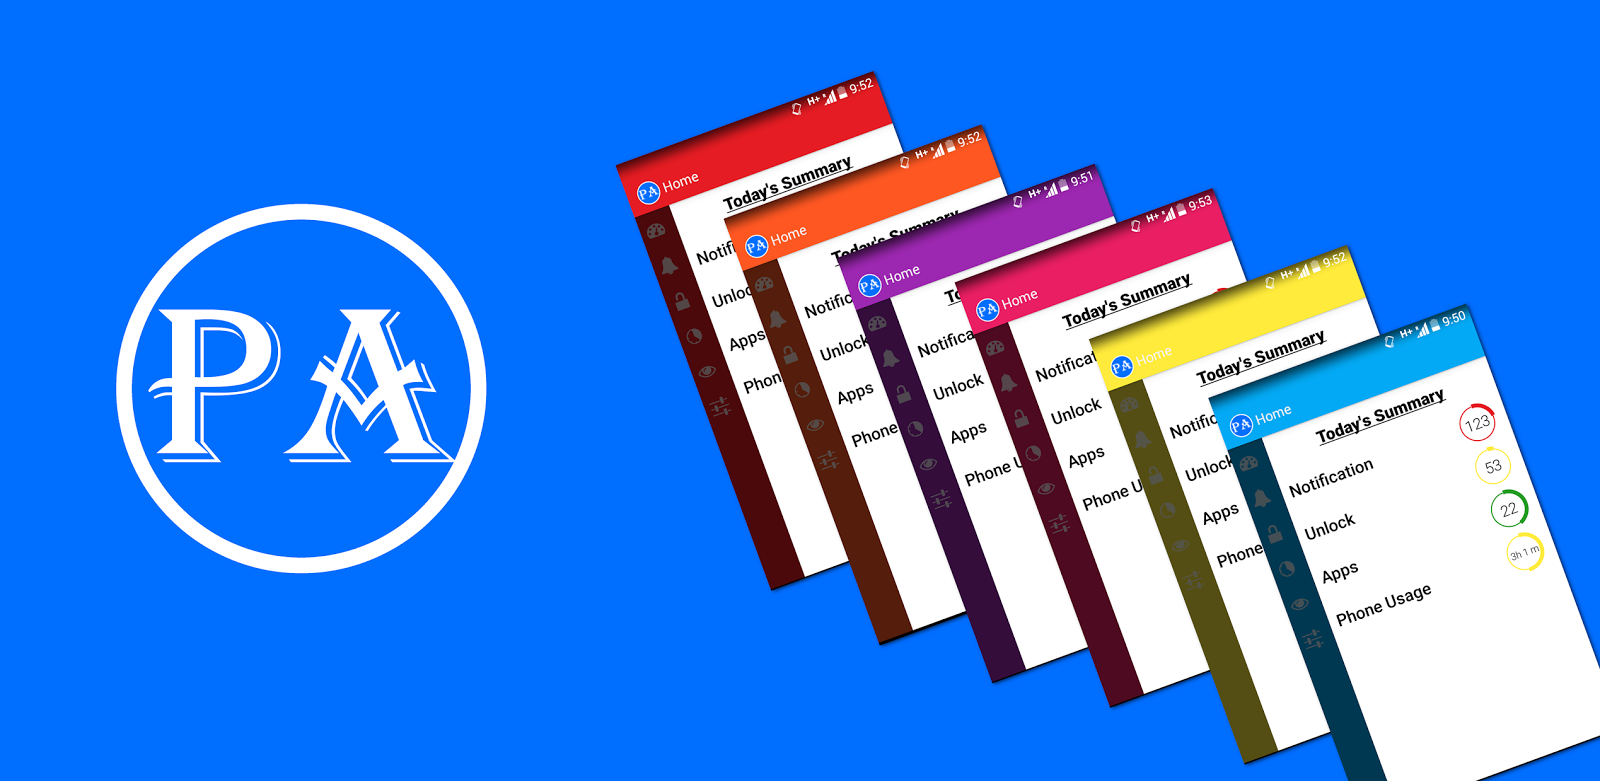
See Daily Summary
- Total Number of Notifications you received on the present day.
- How many time you Unlock your Smart Phone.
- How many Apps you opened.
- How many times you used your Smart Phone

Daily Notification
- Beautiful Pie chart will show you the from which Application how many notifications you received on that date.
- You can change the date from "Date" button.

Weekly Notification
- Beautiful Bar chart will show you your weekly notification's received count.
- You can select the starting date on clicking "Week" button and from that date to the next 6 days you will see the graph.

Daily Screen Unlock
- How many Smart Phone is unlocked on that date.
- You can change the date from "Date" button.

Weekly Screen Unlock
- Beautiful Bar chart will show you your weekly screen unlock count. From this you can check if you are able to decrease your phone look-up count or not.
- You can select the starting date on clicking "Week" button and from that date to the next 6 days you will see the graph.

Daily Phone Usage
- How many Smart Phone is Usage on that date.
- You can change the date from "Date" button.

Weekly Phone Usage
- Beautiful Bar chart will show you your weekly Phone Usage duration (in min.). From this you can check if you are able to decrease your phone look-up time or not.
- You can select the starting date on clicking "Week" button and from that date to the next 6 days you will see the graph.

Daily App Usage
- Two beautiful Pie chart will show you the from which App Usage on that date.
- One will show Apps opening count and other will show Apps duration (in min.).
- You can change the date from "Date" button.

Weekly App Usage
- Two beautiful Bar chart will show you the from which App Usage on that date.
- One will show Apps opening count and other will show Apps duration (in min.).
- You can select the starting date on clicking "Week" button and from that date to the next 6 days you will see the graph.

Select your Favorite theme color
could you pls provide source code for this
ReplyDelete